What’s going on at Heathrow Airport
Last year as part of a placement year I worked full-time from an office near Heathrow. Through a little luck I managed to score myself a desk by the window with a pretty cool view. Needless to say I spent plenty of time watching the planes.
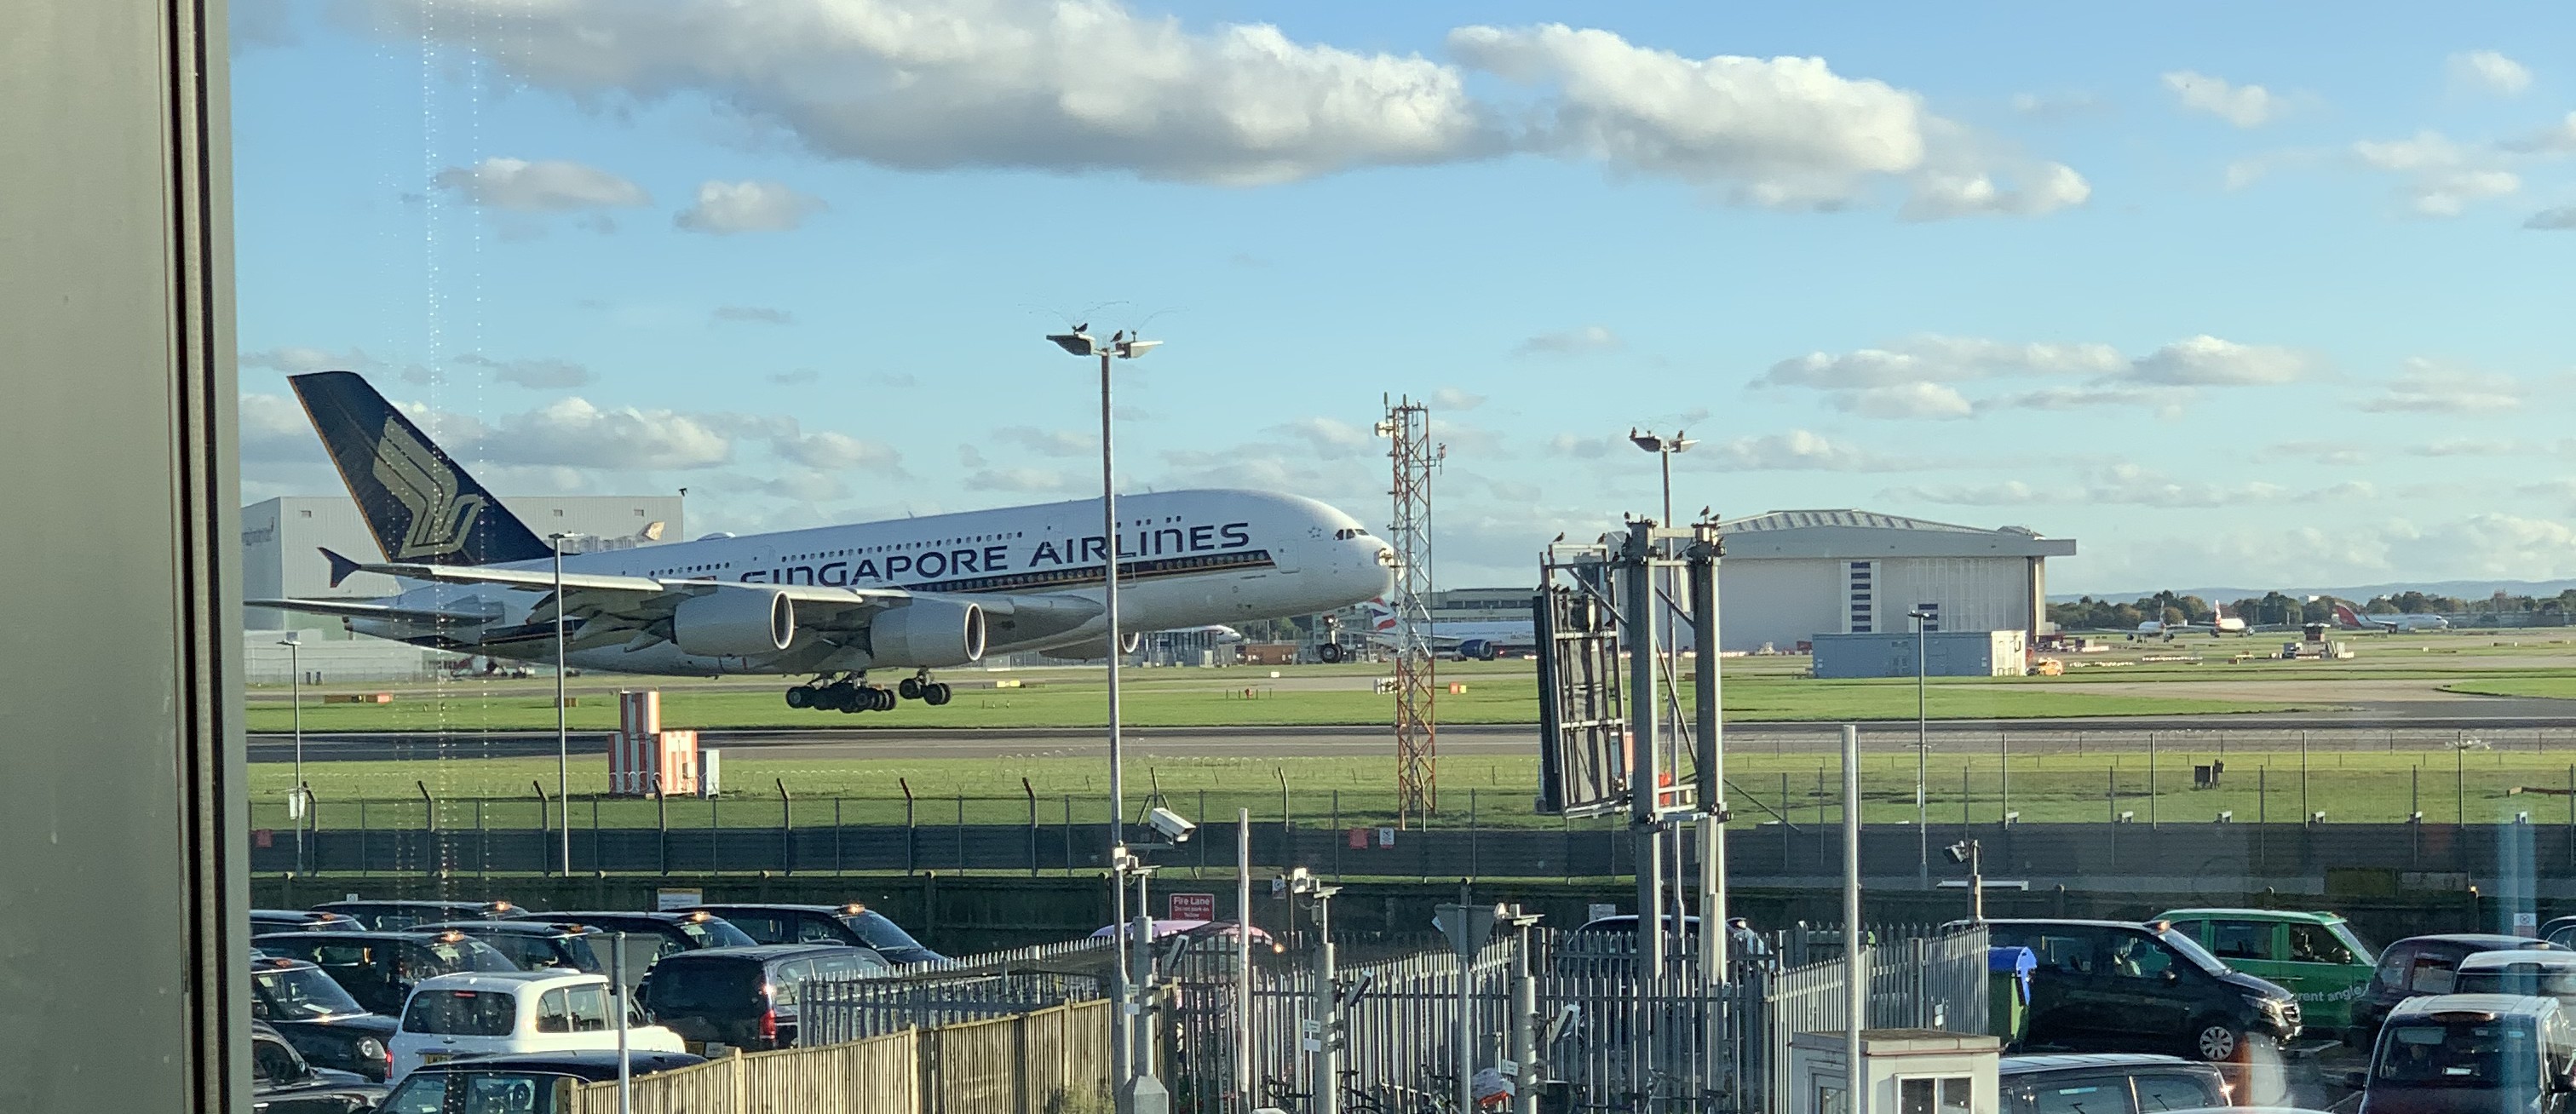
It was pretty quick to notice that somedays were better than others. Sometimes you could see planes taking off, sometimes landing, sometimes you could just about make out some planes in the distance. Within the day even the view would change, the morning being different to the afternoon (specifically the runways rotate at 15:00).
In fact the operation of Heathrow is subject to some rotation due to noise mitigation and the wind. It’s not so important to understand the exact details but if you are interested you can see them here.
Naturally on the way to work I found myself checking to see what the view would be like today. There were two ways I could do this:
- On the twitter account Heathrow Runways which contains updates on the current airport state in natural language.
- On flightradar24 (other flight tracking apps are available) look at the planes and figure out what they are doing.
I generally found myself doing the second. But this takes a little time and a minor investigation. What I really wanted was to be able to go to a website and see in nice big text what is going on.
This would allow me to check from my laptop at home,
during my commute on my phone and even on my work machine at
work. It would also make the site widely accessible to
others if anyone else happened to find it useful. This is
where the idea for lhrNet was born.
The Idea
Since I could tell which “state” the airport is in from looking at flightradar clearly there is a pattern. However the pattern is not easily definable and there is no obvious heuristic. It seems like this might be a good problem for machine learning (the AIs everyone have has been talking about).
In fact we with some creativity this turns out to be anaglous to an image classification problem (a stroke of luck since this is the only type of machine learning problem I have experience with).
We can take a rectangle area centered on Heathrow and
divide it into a grid. For each cell in the grid we consider
it as True if it contains at least one plane
and False otherwise. This gives us the
equivalent of an image with a bit depth of 1. With this
image like representation we can apply standard image
classification techniques to categorise the current state
into one of 7 possible states.
The Implementation
Sourcing The Data
The first major road-block is flight data. Short of setting my own ADS-B receiver near Heathrow (which would be cool) the project requires a source of aircraft position data.
The first thought was to check out flightradar’s API, however a quick look at the pricing page renders this non-viable (since this project has an effectively no budget). Thankfully there is a community option with no cost and a pretty generous rate-limit, OpenSky Network.
This proves to be particularly ideal for his project. Since data is only needed for a small area,the anonymous tier is more than sufficient for site users. This saves the complication of handling authentication.
Unfortunately OpenSky’s historic database is only
accessible to researchers. Instead I left a python script
running on my laptop for a few days requesting the current
state once every ~5 minutes (randint(50,500)
seconds). To label these states I created a timeline of
states over this time this based on posts from HeathrowRunways.
Encoding States
After running this script for a few days I had a decent
training set with each state repsented as a JSON 2D array of
ints (0 for no plane and 1 for 1
or more planes). However this soon became untenable since
the JSON file was getting very large.
One way to fix this would be to switch to some custom
binary encoding. This would allow us to save significant
space, we could even store each cell as a single bit
squeezing 8 cells into each byte (with the naive approach we
have at least 2 bytes per cell 0, with some
additional overhead for brackets, spaces and newlines). This
however is relatively complex.
Thankfully since the matrices are relatively sparse
(mostly 0/False) the much more
simple change to introduce RLE proved to be more than
sufficient.
This is an example CSV with some states (admittedly these are night states and the day time ones are longer since there are more aircraft in the rectangle):
992f1t245f1t809f,3
109f1t134f1t311f1t434f1t81f1t974f,3
183f1t372f1t1491f,3
985f1t6f1t10f1t1044f,3
933f1t176f1t937f,3
The Machine Learning Model
I am no machine learning expert, so the machine learning implementation is very much inspired by my experience with image classification and available image classification examples.
There were some requirements for the model:
- Correctly classify states.
- Be small enough to send to the browser.
- Support inference in the browser.
Requirements 2) and 3) are needed since there was no room in the £0 budget for provision of a backend to serve the model. Instead the model needs to be run directly on the users browser.
With these requirements in mind the designed model was very simple.
# The LHR Net model
model = tf.keras.models.Sequential([
    tf.keras.layers.Input((config.get_y_length(),config.get_x_length())),
    tf.keras.layers.Flatten(),
    tf.keras.layers.Dense(128,activation="relu"),
    tf.keras.layers.Dropout(0.2),
    tf.keras.layers.Dense(64,activation="relu"),
    tf.keras.layers.Dense(n_states,activation="softmax")
])
After training the model was exported in onnx
format. Thus allowing the model to be run in the browser
with ONNX
runtime web. The final export model.onnx is
only 1.1MiB, respecting the users bandwith.
The Final Result
The site is (and has been for a while) available at lhr.billyedmoore.com.
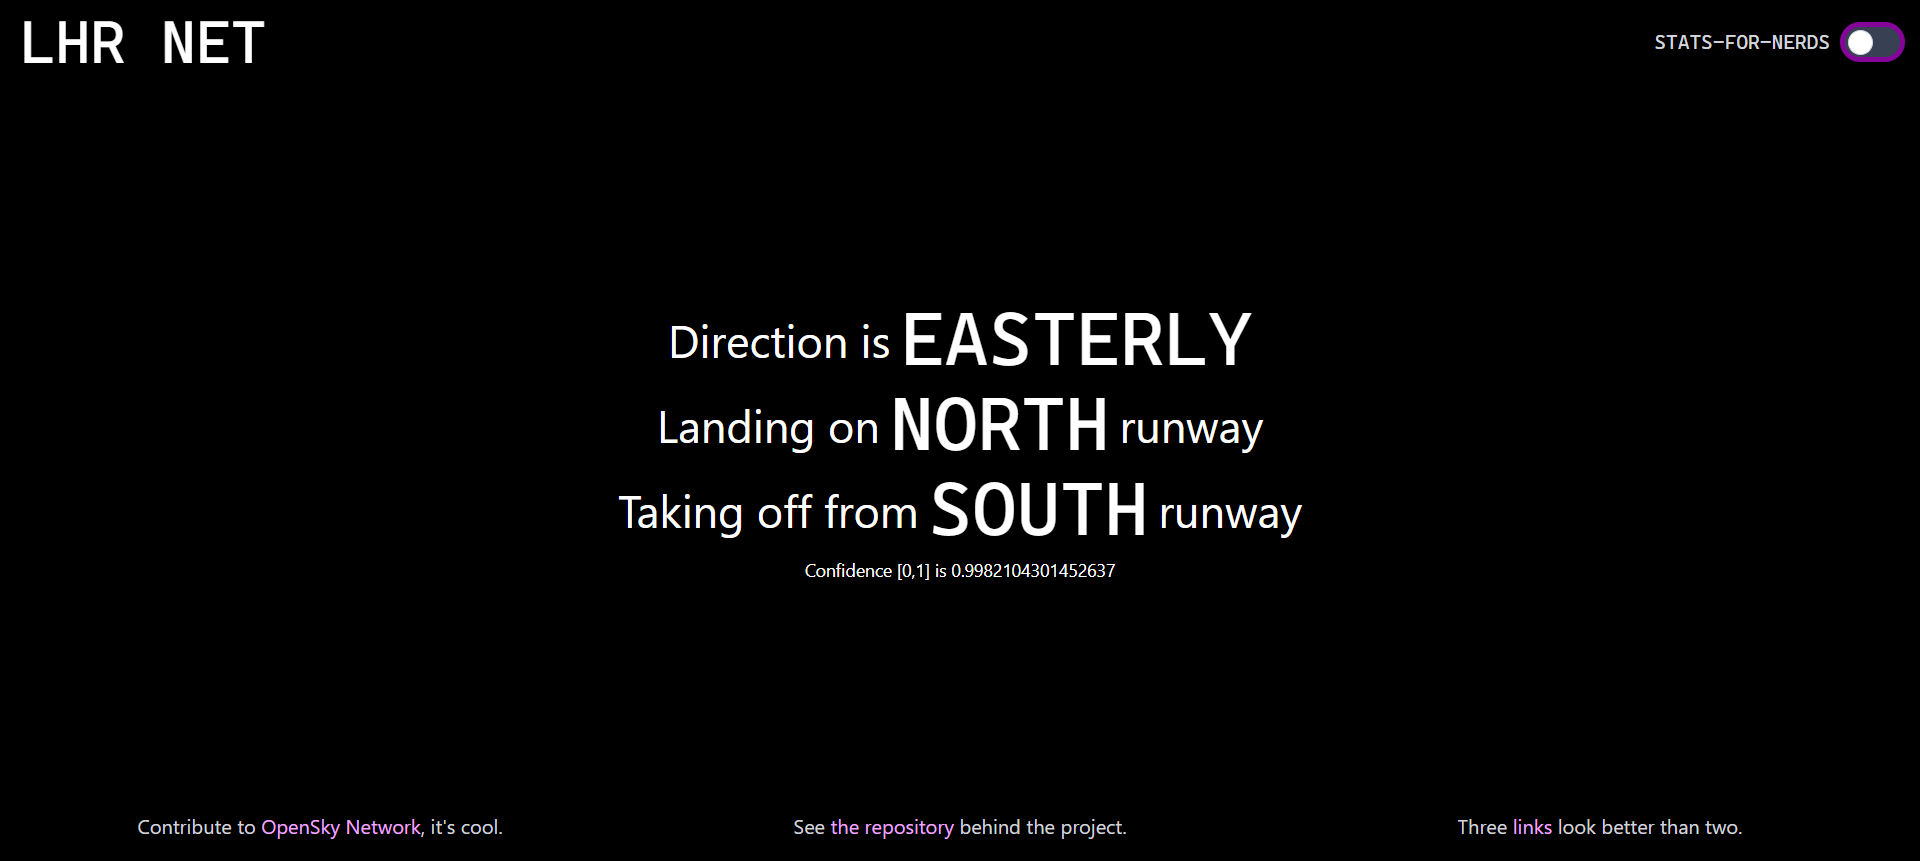
Besides a frontend rewrite a few months ago to move from a very clunky pure JS frontend to a modern TypeScript React frontend. No other work has been required and the model has been working reliably.
The main downside has been a tendancy towards overconfidence (clearly inspired by the rise of ChatGPT). Maybe in future I will add the common AI disclaimer “LHR Net can make mistakes”.
There is also an another minor issue. For an hour in the morning both runways are used for landings (with a single runway also used for take-offs). Since this is relatively rare and similar to the existing state it is largely ignored by the model which instead defaults to the standard one runway for take-off and one for landing.
Conclusion
The website is not overly useful to others, and to be honest since I now live hundreds of miles from Heathrow not overly useful to me. It was however a fun project merging machine learning, data processing, frontend design and even a little bit of basic compression. I scratched my own itch and learnt a bunch in the process.
Once in a while I still load up the website to check if my little model is still calling it right.